With significant reductions in patient volumes continuing to affect healthcare organizations’ financial sustainability in the wake of COVID-19, ECG is conducting monthly assessments of provider productivity for participating organizations. In this longitudinal assessment, ECG is comparing 2020 WRVUs by month to the same period in 2019 for all participating organizations’ providers.
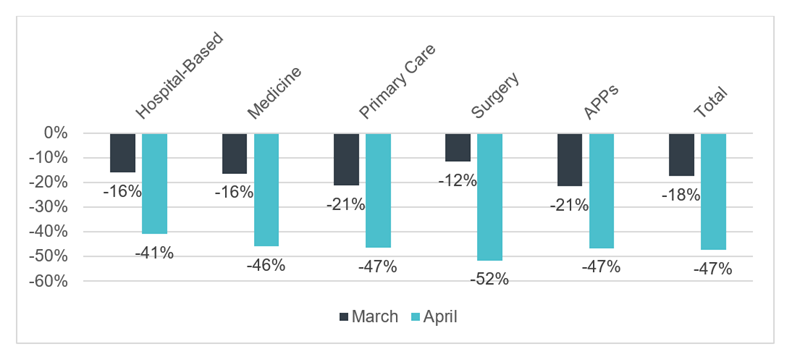
For physicians and advanced practice providers (APPs), we found an average 18% decrease in March 2020 WRVUs compared to March 2019. For April, this loss climbed to 47%.
In March 2020, APPs and primary care physicians were the hardest hit, both experiencing an average WRVU loss of 21% compared to March 2019. In April, surgical physicians saw the greatest loss in WRVUs compared to 2019, with an average variance of 52%. Figure 1 shows the WRVU variance for physician specialty categories as well as APPs across all specialties.
Figure 1: 2020 WRVU Volumes Compared to 2019 by Provider Specialty Category and Month

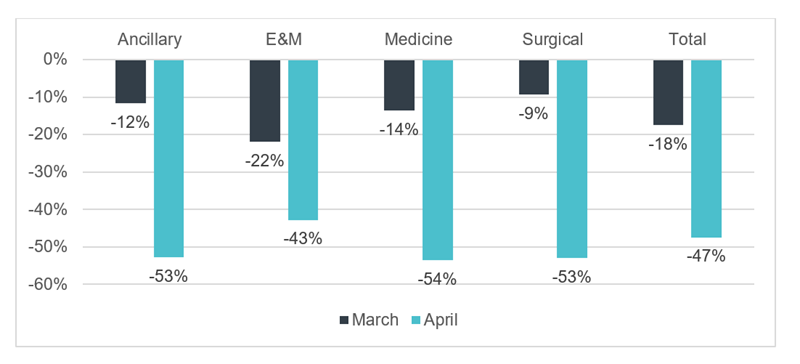
A review of volumes by CPT code types indicates that in March, organizations saw the greatest decrease in E&M CPT codes. The decrease in E&M procedures averaged 22% compared to 2019. In April, organizations saw the greatest decrease in medicine CPT codes, with an average loss of 54% of these volumes. Organizations similarly saw an average loss of 53% in ancillary and surgical volumes. Figure 2 presents the WRVU variance by CPT code type for physicians and APPs.
Figure 2: 2020 WRVU Volumes Compared to 2019 by CPT Code Type

ECG will continue to track WRVU performance trends to determine the speed at which healthcare organizations are recovering volumes lost from COVID‑19. We will update market trends as additional data is received.
To participate in this free study, please contact Maria Hayduk here.
Methodology: ECG calculated WRVUs for both comparator months utilizing CMS’s 2020 WRVU physician fee schedule. For CPT codes deleted from the 2020 schedule, ECG utilized the 2019 fee schedule. Only providers with productivity data in both comparator months were included in the analysis. (March included 2,227 physicians and 884 APPs. April included 1,454 physicians and 516 APPs.) Data was not adjusted for full-time equivalents. Market averages represent the average across participating organizations and are not weighted by number or provider type.

