As the COVID-19 virus began to grip the United States, there was much uncertainty as to how fast the virus would spread, how severe the cases might be, and how highly contagious patients would impact access to hospital beds, ventilators, staffing, and PPE. For healthcare organizations, this situation led to growing concerns about operational protocols, particularly regarding the need for surge capacity to meet peak bed demand.
These concerns are not abating—COVID-positive cases are, in fact, increasing across the country, compounding annual demands from flu season, extending capacity constraints, and creating operational challenges and financial pressures.
Keck Medicine of USC, a 619-bed academic health system based in Los Angeles, needed help determining how the first wave of COVID-19 patients might affect its hospitals and reached out to ECG to develop a forecasting model. Working with Keck leadership, ECG forecasted the spread of COVID-19 throughout Los Angeles County and tracked aggregate bed demand in the area and for Keck’s two general acute hospitals—Keck Hospital of USC (KH) and USC Verdugo Hills Hospital (VHH). This modeling helped Keck plan for both COVID-19-positive and COVID-19-negative patients within its intensive care, medical-surgical, and pediatric units. Importantly, it also helped Keck determine when and how to ramp up nonessential procedures following the statewide elective procedure postponement.
I. Modeling the Anticipated Impact of a Virus
Due to the nature of a novel virus and the lack of documented study of COVID-19, it was unclear which infectious disease model would most appropriately capture the virus’s behavior and enable adequate prediction. ECG chose to use the susceptible, infectious, and recovered (SIR) model, a proven, differential equation model that groups the population into three compartments—S, I, and R—representing a set of dependent variables that are a function of time. One of the benefits of the SIR model is that it required fewer assumptions about uncertain aspects of the virus, such as whether asymptomatic patients were contagious and how long patients would remain immune after recovering.
ECG and Keck worked with the Los Angeles County Department of Public Health as a source for daily infection counts over a four-month period, utilizing the available data arranged by age cohorts. The model was built and populated with this data along with the most recently available census data.
Typically in modeling disease spread, the input assumptions are fairly well tested and studied; but due to the nature of the novel coronavirus, broader assumptions were required for the model’s other inputs, including the average contagious period; the R0, or transmission rate, which varies and changes based on a population’s behavior; and the comprehensiveness of testing. The model was structured to yield conservative, moderate, and aggressive scenarios to provide a range of outputs. Data trends were captured so the forecast could easily be updated with historical information.
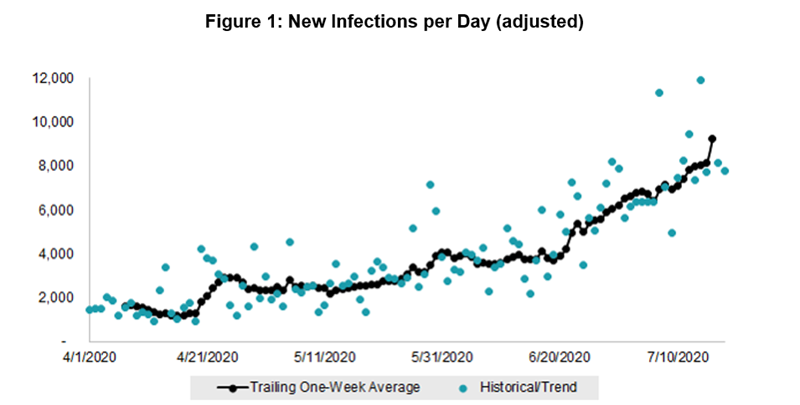
Figure 1 is one of the graphs created to illustrate the spread of COVID-19 throughout Los Angeles County.

Note: New infections per day adjustment assumes that only 35% of new cases are being reported, a variable built into the model that was modified as time passed based on a variety of factors.
II. Bed Demand
To determine overall bed demand for the county, we modeled both the total number of available beds county-wide and the number of non-COVID-19-related beds needed. As a baseline for these totals, we employed California’s Office of Statewide Health Planning and Development (OSHPD) utilization and financial data for all Los Angeles County general acute care hospitals. Although this data lagged current conditions, it proved to be the most applicable and readily available.
Compounding what the data showed was the effect COVID-19 was having on non-COVID-related patient volumes. With elective procedures being canceled and patients steering clear of emergency departments (EDs), baseline hospital bed utilization was shrinking. Assumptions were developed about the degree of volume decrease expected county-wide then tracked and regularly modified and updated against Keck’s actual experience. The gap between the decreased baseline demand and the number of available beds represented the capacity available for COVID-19-positive patients.
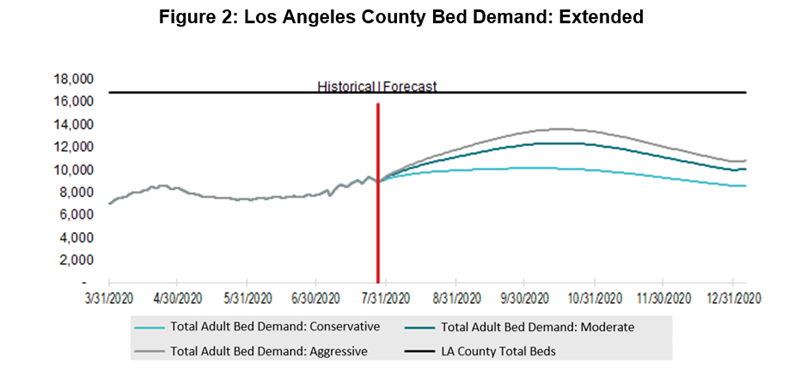
Figure 2 illustrates bed demand in Los Angeles County. It indicates a lull in bed demand in May due to decreased ED visits and elective procedures and then demand increasing again beginning in June as the virus continued to spread.

With models in place for the predicted bed availability and number of individuals infected with COVID-19 on any given day, the number of infections could be translated into hospitalizations. This is where age cohort data enabled a more precise prediction, as the elderly were much more susceptible to the virus than younger people. Accordingly, hospitalization rates were assumed, including the proportion of hospitalizations requiring an ICU bed, based on the age group sensitivity and tracked data historically, making adjustments over time. We also made assumptions for hospital lengths of stay, sensitive to each age cohort and corresponding bed type, to understand how the inpatient COVID-19 volumes might compound as the days and weeks progressed.
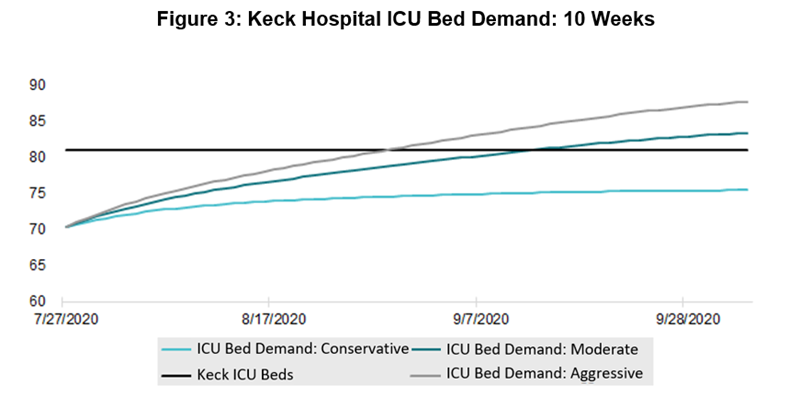
Figure 3 illustrates anticipated KH ICU bed demand based on the hospital’s non-COVID-19-related ICU population and the impact on KH of the virus’s spread. Despite KH’s lack of an ED, which was the “front door” for COVID-19 patients at so many other healthcare provider organizations, a COVID-19 bed demand was observed and carefully managed via patient transfers.

III. Conclusions and Expansion Possibilities
The model was updated and monitored daily from April through early August 2020, when the spread of the virus slowed enough to ease operational concerns regarding bed capacity by type—at least as of this writing. Fortunately, the bed demand resulting from COVID-19 did not exceed the bed supply in Los Angeles County through October 2020, nor at KH or VHH. Each hospital established COVID-19 bed units but did not need to create new or temporary beds to meet demand. This is changing, however, as the anticipated surge in cases has been realized, with increasing positive cases and hospitalizations across 41 of the 50 states
Ultimately, insight gained through the modeling exercise—fueled by vigilant maintenance of the model—allowed Keck to responsibly return to a higher occupancy rate, with greater confidence, and over an accelerated time frame. Keck was able to systematically ramp up elective procedures to help mitigate the financial strain it experienced during the peak of the pandemic (common to most hospitals during that time). Should a second wave of COVID-19 or another pandemic be encountered, this model can be revived for Keck or similarly adapted for any other hospital or health system across the country.
At the time of this publication, a vaccine is not publicly available and the current understanding is that individuals who are infected can be reinfected months later. The possibility that COVID-19 immunity wanes over a period of several months may indicate that a SIRS (i.e., susceptible, infected, recovered, and susceptible) model could be a more accurate prediction tool over an extended period of time.
With the upswing in COVID-19 cases and the advent of flu season, contact ECG to learn how we can help your organization better forecast bed need and resource deployment.

